What's the Call Quality Dashboard, and when should I use it?
Call Analytics is designed to help admins and helpdesk agents troubleshoot call quality problems with specific calls. Call Quality Dashboard (CQD) is designed to help Teams admins and network engineers optimize a network. CQD shifts focus from specific users and instead looks at aggregate information for an entire Teams or Skype for Business organization.
For more information, see Features of the Call Quality Dashboard for Teams.
Use Case: Suppose a user's poor call quality is due to a network issue that also affects many other users. The individual call experience isn't visible in CQD, but the overall quality of calls made using Microsoft Teams is captured. With CQD, overall patterns may become apparent, so network engineers can make informed assessments of call quality. CQD provides reports of call quality metrics that give you insight into overall call quality, server-client streams, client-client streams, and voice quality SLA.
Overview Reports
All editions of the CQD provide a high-level entry point to the overall call quality information, but the way information is presented in Summary Reports is different from Detailed Reports. Summary Reports provide a simplified tabbed page report view so you can quickly browse and understand the overall call quality status and trends.
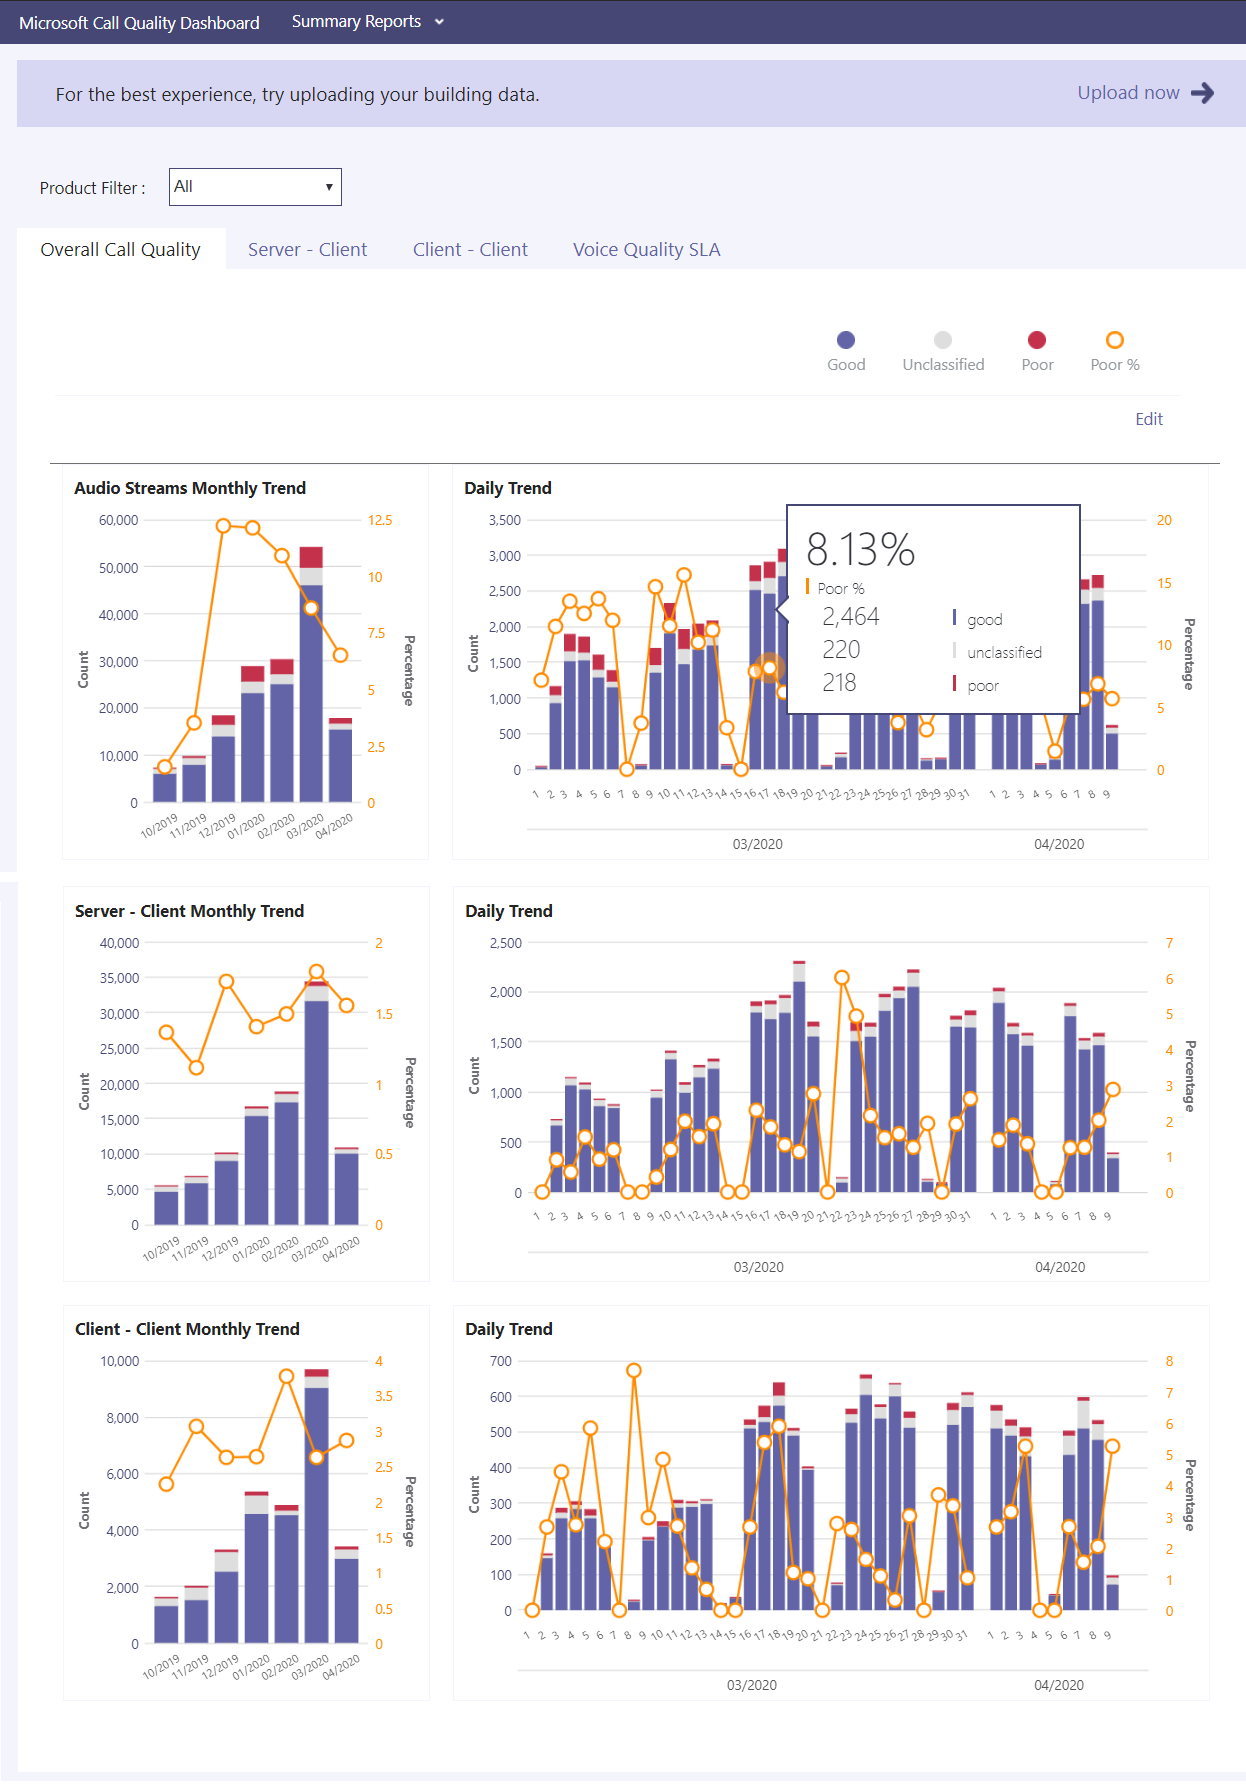
There are four tabs included in the overall reports:
- Overall Call Quality — provides information about all streams, which is an aggregation that shows monthly and daily trends for:
- Server-Client streams
- Client-Client streams
- Separate Server-Client and Client-Client streams
- Server—Client — provides details for the streams between Server and Client endpoints.
- Client—Client — provides details for the streams between two Client endpoints.
- Voice Quality SLA — provides information about calls that are included in the Skype for Business Online Voice Quality SLA.
Call Quality by Region:
- date-by-region
- aggregated down to hour-by-region
- specific locations
- specific subnet
- impacted user or users
Call Reliability/Failure by Region:
- date-by-region
- aggregated down to hour-by-region
- specific locations
- specific subnet
- impacted user or users
Rate My Call (RMC) by Region: from month-by-region aggregated down to specific locations to users who provide low RMC ratings. CQD v3 also includes verbatim feedback.
Helpdesk: available for a specific user on P2P calls or Meetings, or for all participants and call details. Helps identify possible system issues based on network location, devices, or firmware.
Client Versions: View the Session and Users counts for each Client Version, or drill down to User names for each client version. Pre-built filters for Product and Client Type help focus the versions to specific clients.
Endpoints: Shows Machine Endpoints mapped to Make/Model of the PC/Mac. Shows aggregated quality by Make/Model. Mapping data is uploaded similar to Building data.
Using Power BI to analyze Call Quality Dashboard Data for Microsoft Teams
In January 2020, Microsoft introduced customizable Power BI templates you can use to analyze and report your Call Quality Dashboard data.
For CQD reports in Teams, if you'd rather use Power BI to query and report your data, download our CQD Power BI templates. When you open the templates in Power BI, you'll be prompted to sign in with your CQD admin credentials. You can customize these query templates and distribute them to anyone in your organization who has a Power BI license and CQD admin permissions.
Teams Utilization Reports
The Teams Utilization reports lets you see how (and how much) your users are using Microsoft Teams. These reports are intended to be a centralized location that both administrators and business leaders can quickly go to for this data. The Teams Utilization Power BI report consists of two primary reports: Call Count Summary and Audio Minutes Summary.
PSTN Direct Routing Report
The PSTN Direct Routing Report helps customers to understand the usage patterns and quality of their PSTN services monitor information about your SBC, the telephony service, the network parameters, and Network Effectiveness Ratio details and usage of the service. This information can help you identify issues, including the reason for dropped calls. For example, you will be able to know when volume drops, how many calls get affected by what reason.
The PSTN Direct Routing Report has four sections:
PSTN Overview Provides the following information related to overall health of the service for the past 180 days.
Service Details This page provides service usage trends per day and user feedback breakdown by geographic.
- Total Attempt Calls – Total attempt calls in that time range, including both success and failed calls
- Total Connected Calls - Total connected calls in that time range
- Total Minutes – Total minute usage in that time range
- Daily Active Users – Count of daily active user who made at least one connected call in that day
- Concurrent Calls – Max of simultaneous active calls in a minute
- User Feedback – "Rate My Call" score comes from the user. 3-5 is considered as a good call. 1-2 is considered as a bad call.
Network Effectiveness Ratio This is the same metric that appears on the Overall Health dashboard.
NER - The ability (%) of a network to deliver calls by measuring the number of calls sent versus the number of calls delivered to a recipient.
SIP response code - A three-digit integer response code shows the call status.
Microsoft response code-A response code sent out from Microsoft component.
Description – The reason phase that corresponding to the SIP response code and Microsoft response code.
Number of calls affected – The total number of calls got affected during the selected time range.
Network Parameters All network parameters are measured from the Direct Routing interface to the Session Border Controller.
Jitter – Is the millisecond measure of variation in network propagation delay time computed between two endpoints using RTCP (The RTP Control Protocol).
Packet Loss – Is a measure of packet that failed to arrive; it is computed between two endpoints.
Latency - (Also known as round trip time) is the length of time it takes for a signal to be sent plus the length of time it takes for the acknowledgment of that signal to be received. This time delay consists of the propagation times between the two points of a signal.
For information about the recommended values, see Prepare your organization's network for Microsoft Teams, and look at the Customer Edge to Microsoft Edge recommended values.