1. Introduction
1.1 What is the Evolve Contact Suite Dashboard?
The Dashboard provides supervisors and administrators with insight into their current contact center activity. It allows contact center leaders to monitor their assigned Business Processes and agent activities in real-time.
The Dashboard allows contact center supervisors to:
- Monitor all media types across each Business Process
- Manage Thresholds and Alerts for various contact center metrics
- Review agent’s current status and activity
- Monitor and adjust SLA goals for all or a single Business Process
- Monitor all media types across each Business Process
These activities as well as other available activities are described in detail in this User Guide.
1.2 Audience
This document is targeted at Contact Center Supervisors and Managers who will use the Dashboard Client.
1.3 Omnichannel
As consumer technology has changed, so have expectations around how customers interact with companies. Customers expect the ability to interact over multiple channels (email, text, web chat, social media, calls, etc.) seamlessly. Contact centers need to deliver outstanding customer service through omnichannel technology that empowers their agents’ success.
Many contact centers struggle with multi-channel solutions that involve multiple technology silos that hinder customer satisfaction and management visibility. Evolve IP offers true omnichannel technology.
2. Dashboard Overview
Your system administrator or Evolve IP Project Manager will assist you with your credentials and relevant URL to access your Dashboard.
- Settings – manage the Business Processes (BPs), Statistics, Media types and Thresholds within the main dashboard view
- Dashboard View – provides summary and individual BP and Agent statistics
- BP View – drill down into BP and agent stats
3. Settings
Upon first login, the wallboard view will display all available BPs and media type statistics. By selecting the settings icon ![]() next to Total Queue Activity you can manage the BPs, media type statistics and notifications for your dashboard.
next to Total Queue Activity you can manage the BPs, media type statistics and notifications for your dashboard.
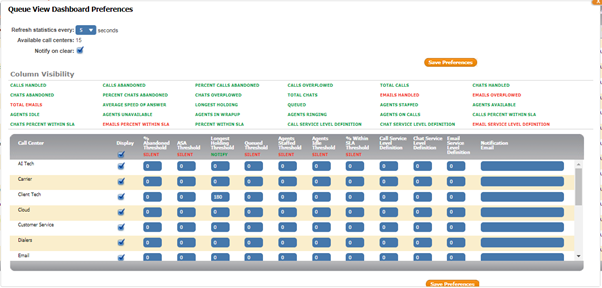
- Refresh Statistics Every: You can change the refresh rate of the screens starting at 1-15 increments or 30, 60 or 90 seconds. The default refresh rate is 5 seconds.
- Available Call Centers: Total number of available Business Process(es) to view
- Notify on Clear: When threshold notifications clear, an email will be generated to alert you that your thresholds have been met. An email address must be entered under the Notification Email column within the preferences window in order to receive the clear notification.
- Column Visibility: Manage which Statistics and Agent Activity will be visible on the dashboard. By default, all options will be visible and highlighted in green (
 ), representing the visible state. Clicking on any column option will turn it red (
 ), indicating it is now hidden from the main dashboard view. You must have at least one column VISIBLE at all times (Service Level Definition does not count as one of the display columns).
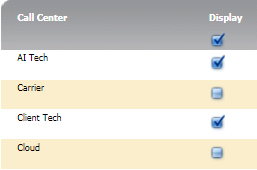
 - Call Center Display – Manage the Business Processes that are displayed on the Dashboard. Any BP selected in the display column will be viewable on the Dashboard. To remove the BP from view, uncheck the display box.
- Threshold Notifications
- Selecting NOTIFY (
 ) will send an email notification once the threshold is met and will turn red on the queue view of the main Dashboard view.
 - Selecting SILENT (
 ) will not send an email notification for the threshold setting.
 - To copy the same threshold to each queue within the same column, enter the threshold to the first queue at the top of the column and then click on the Threshold Name. This will copy the threshold all the way down that column.
- To clear out the threshold for the entire column, enter 0 next to the first queue at the top of the column and click on the Threshold Name.
- To clear all emails found under the Notification Email column, delete the email address at the top of the column and then click on the Notification Email.
- Available Thresholds:
- % Abandoned Threshold: The percent of calls abandoned. To set this, enter a number between 1-100 in order to start monitoring this threshold.
- ASA Threshold: The average speed of answer. This must be entered in seconds.
- Longest Holding Threshold: The longest holding interaction threshold. This must be entered in seconds.
- Queued Threshold: The amount of queued interactions to be answered.
- Agents Staffed: The number of agents staffed in the BP.
- Agents Idle: The number of agents that are idle and Ready to receive an interaction.
- % Within SLA: Percent of interactions that met the Service Level (SL) goal. This can be from 0-100.
- Call Service Level Definition: The amount of time required to answer a call to meet your SL goal. This must be entered in seconds.
- Chat Service Level Definition: The amount of time required to answer a chat interaction to meet your SL goal. This must be entered in seconds.
- Email Service Level Definition: The amount of time required to answer an email interaction to meet your SL goal. This must be entered in seconds.
- Click on Save Preferences
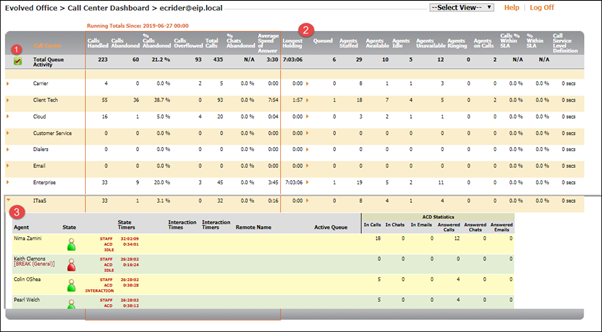
4. Dashboard
The Dashboard provides a summary of all Business Process statistics as well as the individual BP and Agent Statistics for the business day.
The application calculates the statistics based on a single day’s activity. The day begins at 12:00:00am EST or customized to begin at 12:00:00am of your time zone, shown in the ‘Running Totals Since: Data/Time’ view directly above the Total Queue Activity view. Upon logging in, the application reaches out to the ACD/Queue Statistics for the day and populates the application with all activity. Statistics are NOT populated based on login time of the individual user.

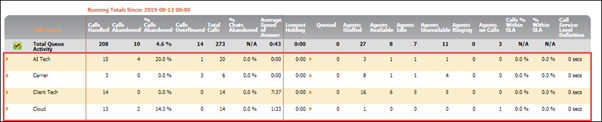
4.1 Total Queue Activity
The Total Queue Activity row provides a summary of all BP and agent statistics for that day.

4.2 Business Process View
4.2.1 BP Metrics
The following are the viewable real-time queue and staffing statistics shown in the total queue activity and individual BP view.
You can sort The Dashboard by clicking on the Queue View Metrics column of your choice.
- Calls Handled: Number of Calls Answered
- Chats Handled: Number of Chats Answered
- Emails Handled: Number of Emails Answered
- Calls Abandoned: Number of calls where the customer hung-up prior to speaking with a representative
- Chats Abandoned: Number of chats a customer abandons prior to being connected with a representative
- % Calls Abandoned: Percent of total queued calls that were abandoned in queue or while ringing. Calculation is: Calls Abandoned / Total Calls *100
- % Chats Abandoned: Percent of total queued chats that were abandoned. Calculation is: Chats Abandoned / Total Chats *100
- Calls Overflowed: Number of calls that overflowed out of the queue
- Chats Overflowed: Number of chats that overflowed out of the queue
- Emails Overflowed: Number of emails that overflowed out of the queue
- Total Calls: Calls Handled + Calls Abandoned + Calls Overflowed
- Total Chats: Chats Handled + Chats Abandoned + Chats Overflowed
- Total Emails: Emails Handled + Emails Overflowed
- Average Speed of Answer: The average amount of time it takes before interactions are answered by agents. This value includes time waiting in the queue and time while the interaction is being offered to an agent. Calculation is: (Sum of each completed interaction’s time in queue + time being offered to an agent) / Total number of interactions answered.
- Longest Holding: The length of time the oldest interaction is waiting in queue (including time being offered to an agent) to be answered. When there are interactions in queue, you can click on the to view the details. See the “Longest Holding” section below for more details.
- Queued: Total number of interactions in queue
- Agents Staffed: Number of agents currently staffed (joined and logged-in)
- Agents Available: Number of agents in a Ready state, either on a call or available to take a call.
- Agents Idle: Number of agents in an available state, not currently on a call.
- Agents Unavailable: Number of agents logged-in and not in a Ready state.
- Agents in Wrapup: Number of agents in a Wrap Up state
- Agents Ringing: Number of agents currently staffed, who are being offered with an interaction
- Agents On Calls: Number of agents currently handling a queued call
- Calls % within SLA: The number of calls that are within the service level defined in the Calls Service Level Definition
- Chats % within SLA: The number of chats that are within the service level defined in the Chats Service Level Definition
- Emails % within SLA: The number of emails that are within the service level defined in the Email Service Level Definition
- % within SLA: The number of interactions that are within the service level defined in the Service Level Definition
- Service Level Definition: The number of seconds in which interactions are expected to be answered
4.2.2 Longest Holding
Longest holding gives you the duration of the oldest interaction waiting to be answered.
By clicking on the will expand the Longest Holding column to display all interactions currently waiting in queue.

- State: Current activity of Queue.
- Queue Entry Time: Time of day (ET) the interaction arrived into the BP
- Queue Wait Time: Total waiting time of the interaction
- Caller ID: Agent Name, Destination or Origination Name
4.2.3 Expanded Business Process View
Within the expanded BP View you’ll be able to get a detailed look of the current activity of the agents assigned to that BP by clicking on the ![]() .
.
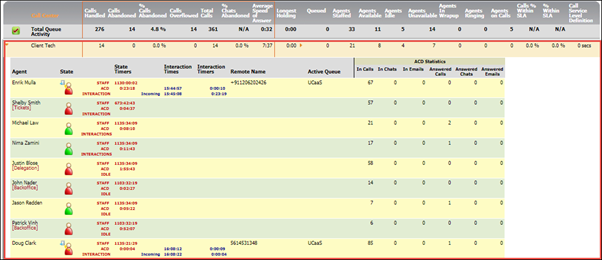
The following information is available:
- Agent: Name of agent.
- State: Current activity of agent. A full list of the Agent Icons and their definition are located in the Agent Icon section of this document.
- State Detail: Detailed information on the current activity of the agent.
- State Timers: Total time within activity since midnight ET.
- Call Detail: Detailed information on the current state of the call
- Interaction Times: The time of day arrival of the interaction in ET military format.
- Interaction Timers: Time spent in interaction state.
- Remote Name: The caller ID phone number or name of the interaction.
- Active Queue: If the agent is handling an interaction outside the selected queue, this field will populate with the interaction’s active queue.
- In Calls: The number of calls presented from the BP to the agent.
- In Chats: The number of chats presented from the BP to the agent.
- In Emails: The number of emails presented from the BP to the agent.
- Answered Calls: The number of calls that were answered by the agent.
- Answered Chats: The number of chats that were answered by the agent.
- Answered Emails: The number of emails that were answered by the agent.
4.2.4 Agent and Queue Icons
Available | Agent is logged-in and in the Ready State to receive interactions from the Queue. |
Unavailable | Agent is logged-in and not in the Ready State and will not receive interactions from the Queue. |
Wrap Up | Agent is logged-in and in the Wrap Up State. |
Logged In | Agent is logged-in to the system, but has not selected a state for the Queue. |
Logged Out | Agent is logged out of the system. |
Ringing | An interactions is being offered to the agent and not yet answered |
Inbound Call | Agent is handling an incoming interaction. |
Outbound Call | Agent is handling an outbound interaction. |
In-Queue Call | Agent is handling an interaction for the selected BP. |
Non-ACD Call | Agent is handling a direct interaction to their DID/EXT or on an outbound interaction. |
Other Queue Call | Agent is handling an interaction for another BP. |
Call Ringing | Queued interaction is being offered to an agent. |
Call Waiting | Queued interaction is waiting to be answered. |


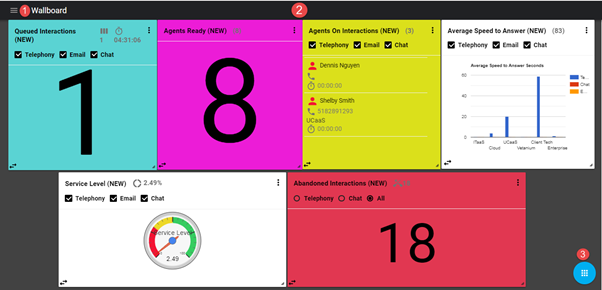
5. Wallboard Overview
The Wallboard may be accessed from the Select View drop down on the Queue view.
- Widget Management – delete, hide or show one or multiple widgets.
- Wallboard View – manage each individual widgets preferences: General, Filters, Scrolling, Styles and Call Centers.
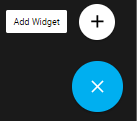
- Actions – add a new widget to your wallboard view.
5.1 Adding a new Widget
The wallboard view will be empty when accessing it for the first time. Each supervisor or manager with a wallboard license will be able to customize their wallboard view with the widgets and statistics they want to monitor.
- Select the Actions Icon and Add Widget

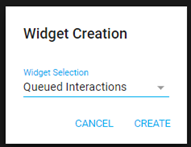
- Select the widget from the Widget Creation popup window and select Create.
Below is a list of available widgets:
- Agents Ready: the total count and detailed list of agents in a Ready state to handle interactions.
- Agents Not Ready: the total count and detailed list of agents with associated Break reason currently unavailable to handle an interaction.
- Agents in Wrap up: the total count and detailed list of agents currently in a Wrap Up state.
- Agents on Interactions: the total count and detailed list of agents currently handling an interaction. Detailed list includes the caller ID and business process for the interaction currently being handled by the agent.
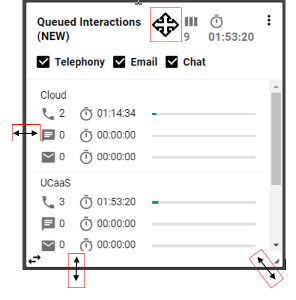
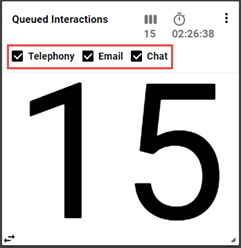
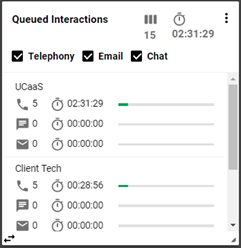
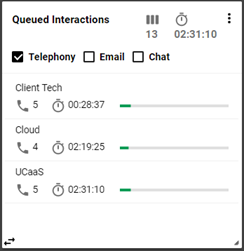
- Queued Interactions: the total count and detailed list of queued interactions across all Business Processes. Detailed Business Process list includes the total number of interactions queued and longest waiting interaction for each media type.
- Abandoned Interactions: the total count and detailed list of abandoned interactions. Detailed Business Process list includes the total count of abandoned interactions across all media types.
- Received Interactions: the total count and detailed list of interactions received by the call center. Detailed Business Process list includes the total number of received interactions across all media types.
- Service Level: the % of interactions answered within the specified service level goal. *Note – the service level must be manually set for each BP in the widget to match the service level goal set in the Setup Client.
- Average Speed to Answer: the average speed to answer in seconds for each Business Process and a detailed view of the average speed of answer across all media types for each BP.
- By default, each widget created will include all Business Processes and media types. Each widget can be customized to show one, some or all BPs and media types. Multiple widgets can be created for the same metric. See Managing Widgets on how to customize each one.
5.2 Managing Widgets
5.2.1 Resize and Moving Widgets
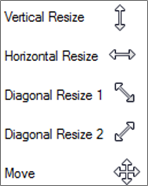
Resize a widget: Select the widget and from the corner or edges, you will see double arrows, allowing you to adjust the widget to your preferred size.
Move a widget: Hover over the header of the widget and you will see the crossed arrows. Click and move the widget to your preferred location.
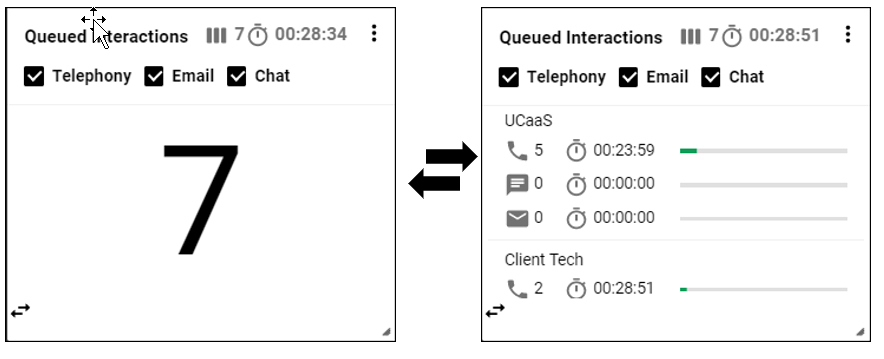
5.2.2 Changing Widgets from Summary to Detailed View
All widgets can be converted from a summary view to a detailed view. Clicking on the double arrow icon in the bottom left hand corner of the widget will toggle between views.
5.2.3 Customizing Widgets
5.2.3.1 Adjusting Media Type
The total count and detailed view of the following widgets can be adjusted to show all or some media types utilized within the contact center:
1.Queued Interactions
2.Answered Interactions
3.Received Interactions
4.Average Speed to Answer
5.Abandoned Interactions
6.Agents on Interactions
7.Service Level
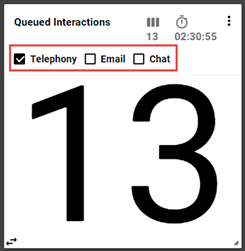
Uncheck the box next to the media type to remove from the widget view. Once selected the counter and detailed view will update to only include the interactions for the selected media type(s).
5.2.3.2 Widget Preferences
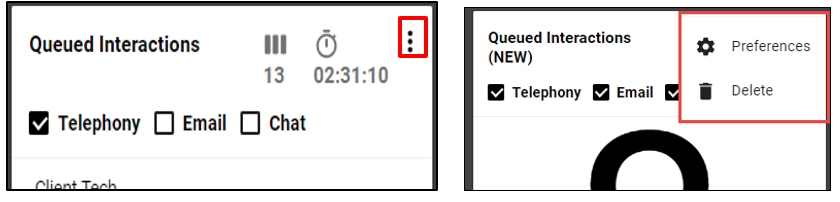
Clicking on the options icon ![]() in the upper right-hand corner of each widget will open up a popup box to either delete the widget or open up preferences.
in the upper right-hand corner of each widget will open up a popup box to either delete the widget or open up preferences.
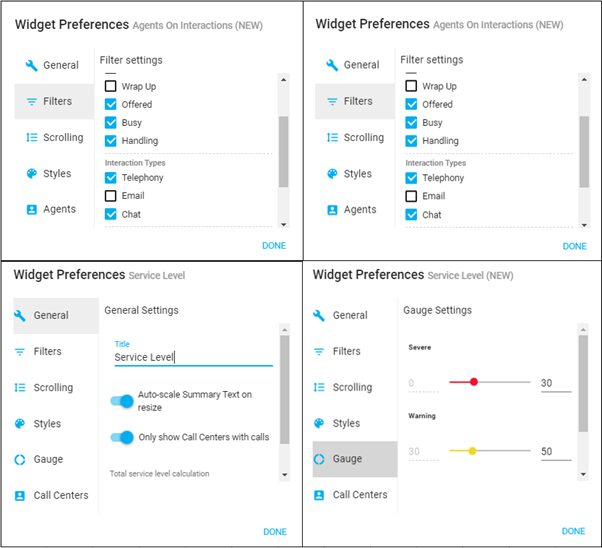
When selecting Preferences, the following options are available:
- General:
- Change the Title of the widget
- Auto-scale Summary Text on resize
- Only show Call Centers with calls
- Total Service Level Calculations: Average of Percentages or Count (recommended)
- Filters: filter by the following options depending on widget type:
- Media Type
- ACD State
- Interaction Direction
- Scrolling:
- Enable Auto Scrolling with scroll speed options
- Hide Scroll Bar when Idle
- Scroll Start Delay Timer
- Styles:
- General Widget Style: Color, Width, and Height
- Top Panel: Color and Font Size
- Call Center Item: Font Size and Color
- Summary Text: Font Size and Color
- Gauge: Service Level widget only to adjust the range the gauge should fall within for severe, warning and normal service levels.
- Agents: display all or a selected group of agents within the widget.
- Call Centers: display all or a selected group of call centers within the widget. Service level widget allows for the individual service level goal for each media type.
Below are examples of the customizable options available for each of the widgets:
5.2.4 Available Widgets
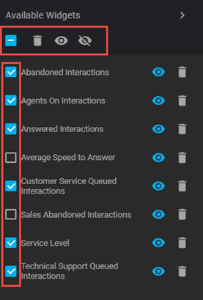
You can manage which widgets are viewable on the wallboard by selecting the Menu icon ![]() in the upper left-hand corner of the wallboard. The Menu option will allow you to hide, view or delete one or multiple widgets from the wallboard view.
in the upper left-hand corner of the wallboard. The Menu option will allow you to hide, view or delete one or multiple widgets from the wallboard view.
Hide/View icon ![]() – When the view icon is highlighted
– When the view icon is highlighted ![]() the widget is currently visable from the wallboard. Selecting the icon will hide the widget from the wallboard view
the widget is currently visable from the wallboard. Selecting the icon will hide the widget from the wallboard view![]()
Delete icon ![]() – Selecting the Delete icon will delete the widget from the wallboard view. A confirmation popup box will appear to confirm you wish to delete the widget.
– Selecting the Delete icon will delete the widget from the wallboard view. A confirmation popup box will appear to confirm you wish to delete the widget.
Select All – By checking the select all check box it will automatically select all widgets within the wallboard to allow for bulk updates: delete, view or hide. When all widgets are selected, unchecking a widget will remove the widget from the bulk update changes.