Overview
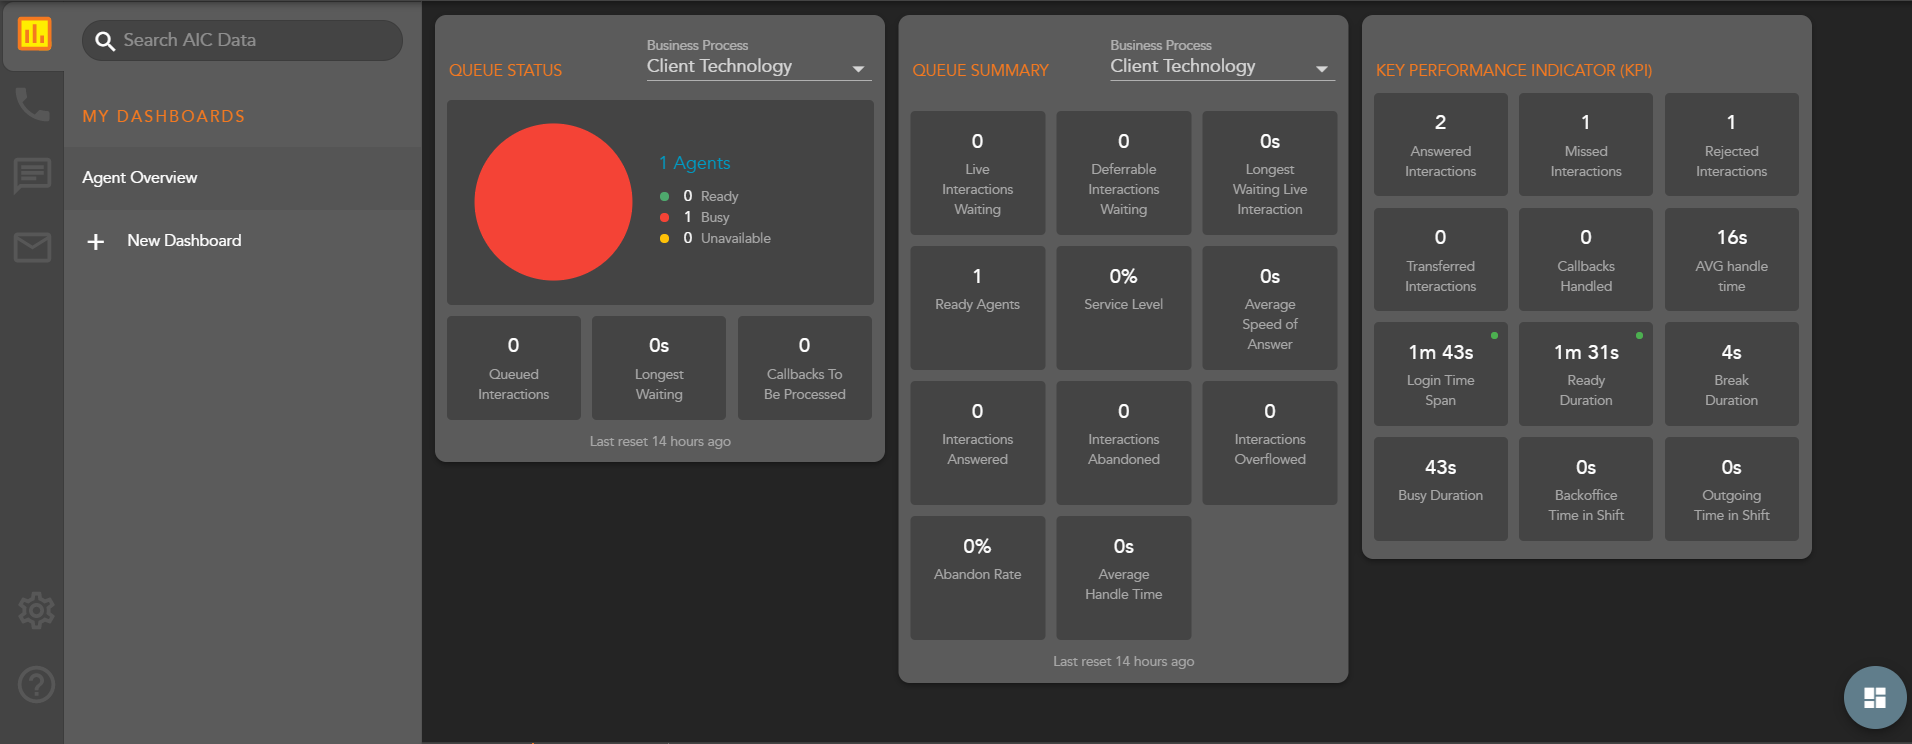
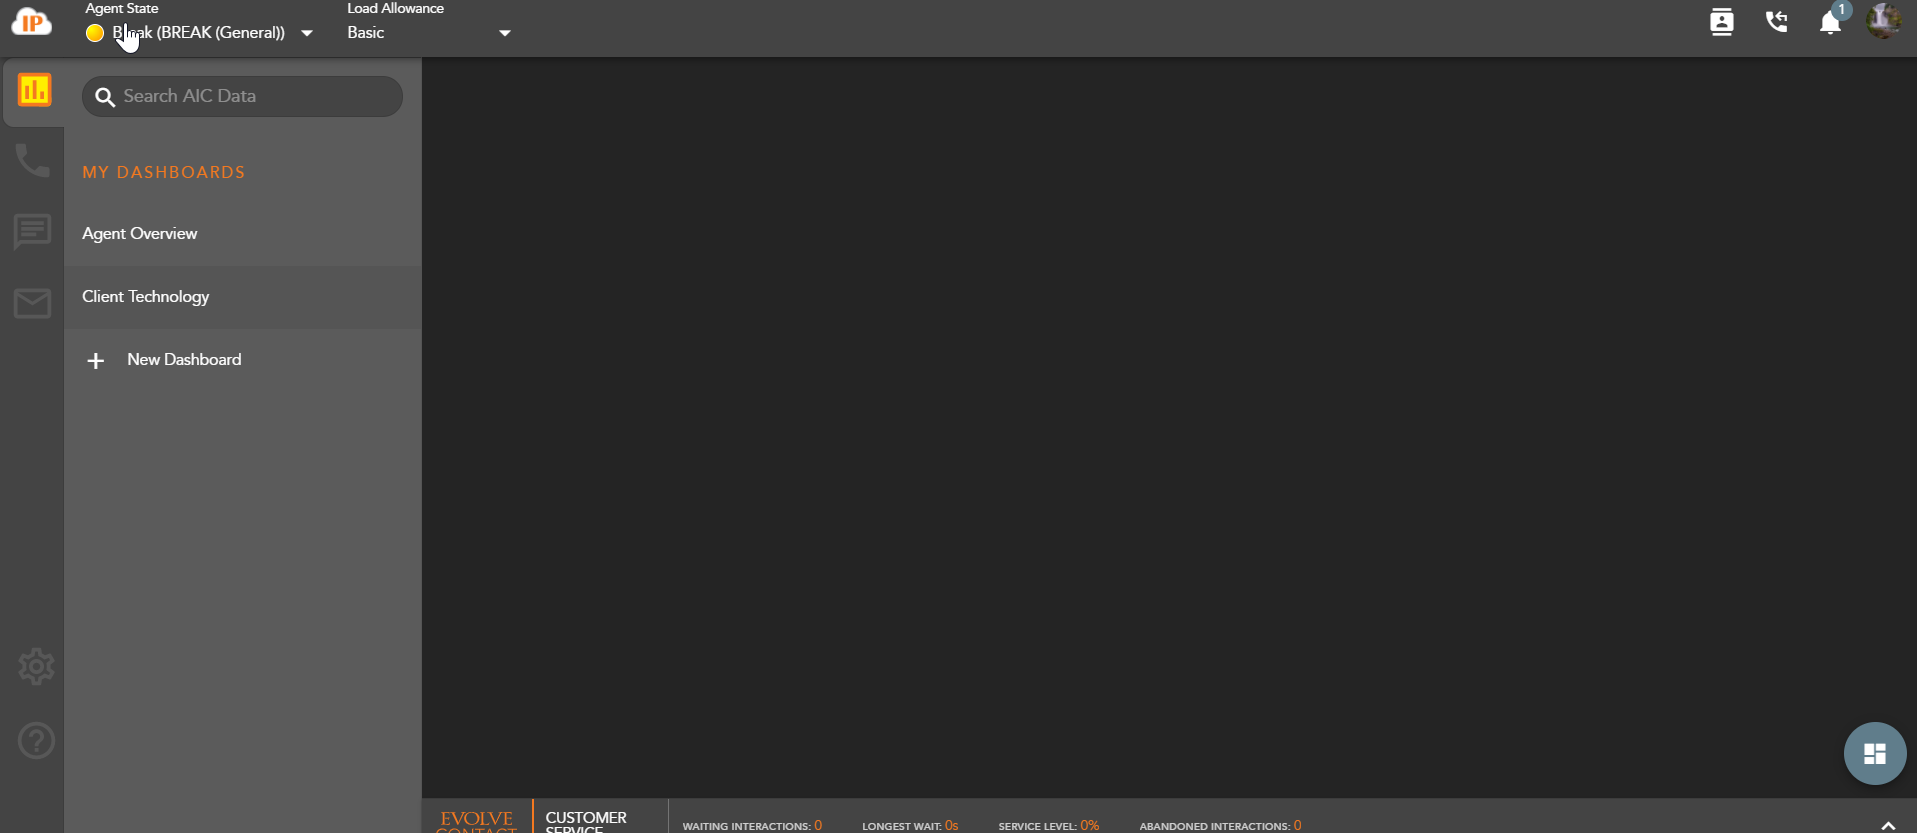
The Agent Intelligence Center is the default view when the agent first logs in. The initial dashboard, Agent Overview, provides the agents with real time statistics on how the contact center is performing and agent statistics, specific to the logged in agent. On initial login the agent application will create a default dashboard view: Agent Overview. This view will consist of one Queue Status, Queue Summary, and Key Performance Indicator (KPI) card. Each queue card will initially default to the first alphabetical BP an agent is assigned.
- Queue Status - provides real time stats on the selected Business Process including:
- Agents in a Ready, Busy or Unavailable state
- Queued Interactions - total number of queued interactions waiting to be handled by an agent
- Longest Waiting (interactions) - the amount of time the longest waiting interaction has been waiting in Queue
- Callbacks To Be Processed - number of callbacks waiting to be processed
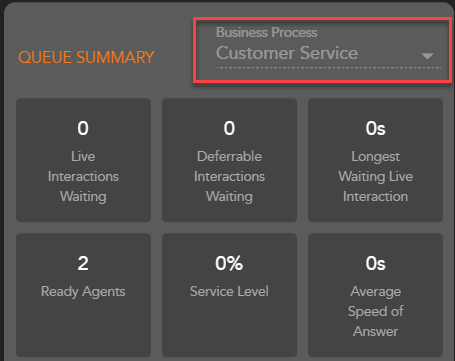
- Queue Summary- provides real time and summary stats on the selected Business Process including:
- Live Interactions Waiting - total number of interactions waiting in queue to be handled by an agent
- Deferrable Interactions Waiting - total number of deferrable interactions waiting in queue to be handled by an agent
- Longest Waiting Live Interaction - the amount of time the longest waiting interaction has been waiting in Queue
- Ready Agents - total number of Ready agents within the Business Process
- Service Level % - the percentage of inbound interactions that entered the queue and an agent responded within the specified time goal
- Average Speed of Answer - average amount of time that a contact waited before an agent answered the interaction
- Interactions Answered - total number of answered interactions
- Interactions Abandoned - any interaction that entered the queue and was abandoned by the contact before reaching an agent
- Interactions Overflowed - total number of overflowed interactions
- Abandon Rate % - the number of abandons / number of queued interactions
- Average Handle Time - Calculated as sum of talk + hold + wrap / the count of queued calls that were answered
- Key Performance Indicator (KPI) - provides real time and summary stats on the agents performance including:
- Answered Interactions - total number of interactions answered by the agent
- Missed Interactions - total number of interactions missed by the agent
- Rejected Interactions - total number of interactions rejected by the agent
- Transferred Interactions - total number of interactions transferred by the agents
- Callbacks Handled - total number of callbacks handled by the agent
- Average Handle Time - agents sum of talk + hold + wrap up / the count of queued interactions the agent answered
- Login Time Duration - total amount of time the agent as been logged in
- Ready Duration - total amount of time spent in a Ready state
- Break Duration - total amount of time spent in a Break state
- Busy Duration - total amount of time spent in a Busy state
- Backoffice Time Duration - total amount of time spent in the Backoffice state
- Outgoing Time Duration - total amount of time spent in the Outgoing state
Editing the Agent Overview
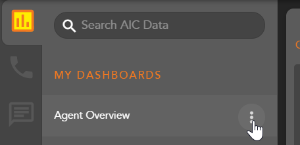
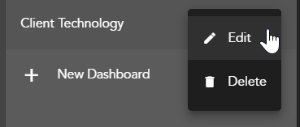
To edit the Agent Overview, select menu options and Edit in the AIC Dashboard Panel or select the Dashboard setup floating action button
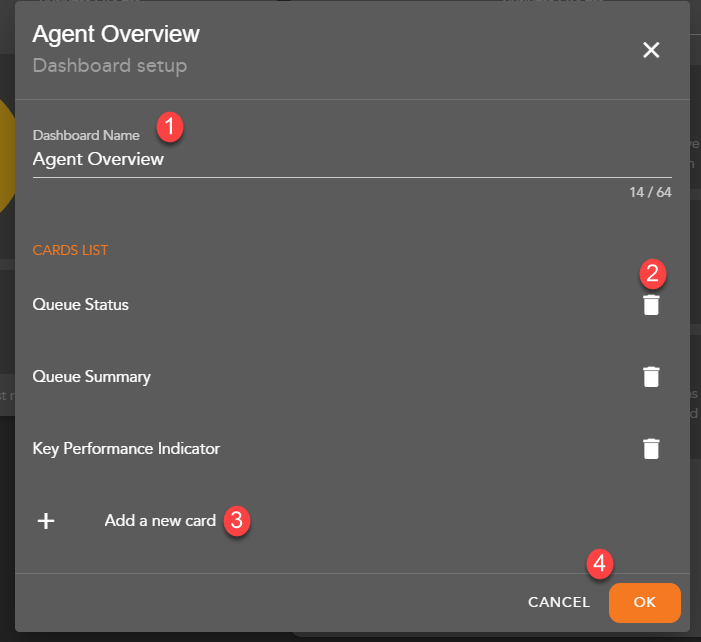
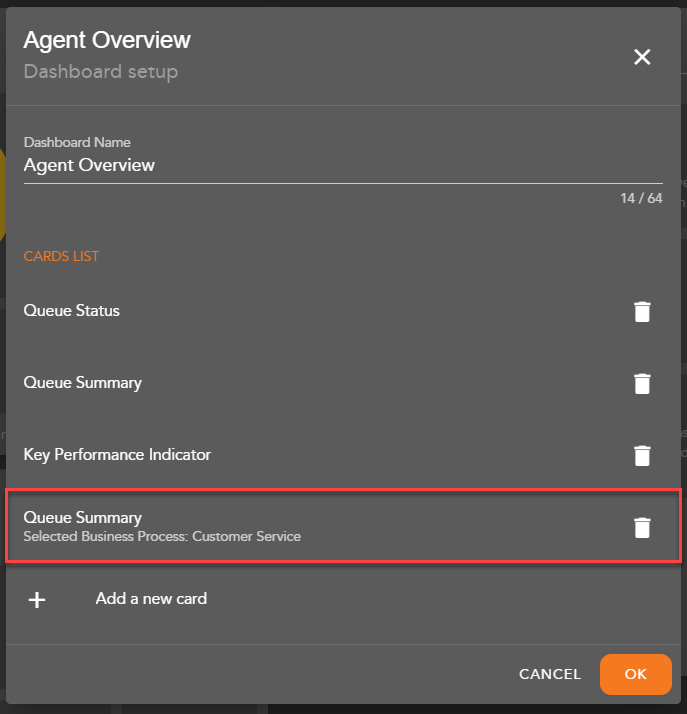
The edit Dashboard window will open with the following options:
- Edit or Rename the Dashboard - provides the ability to change the current dashboard name
- Delete a Card - this will remove a current card from the dashboard view
- Add a New Card - add a new queue status or summary card
- Cancel or OK - closes the window
Adding a New Card
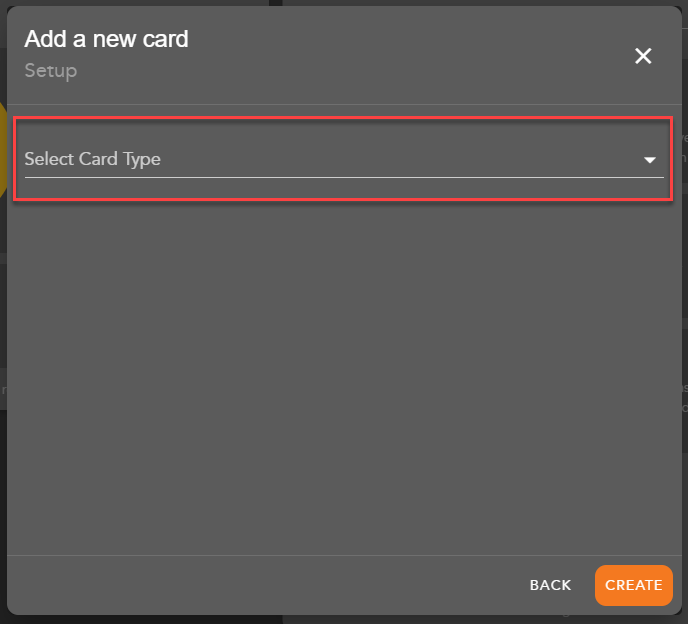
Within the edit dashboard window, you have the ability to add a new card . When selecting this option, the edit Dashboard window will updayr to allow for adding a new card
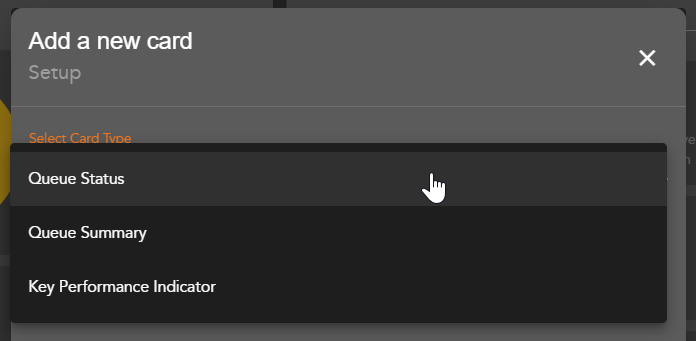
From the Select Card Type drop down select to add a Queue Summary, Queue Status Card or Key Performance Indicator (KPI) Card.
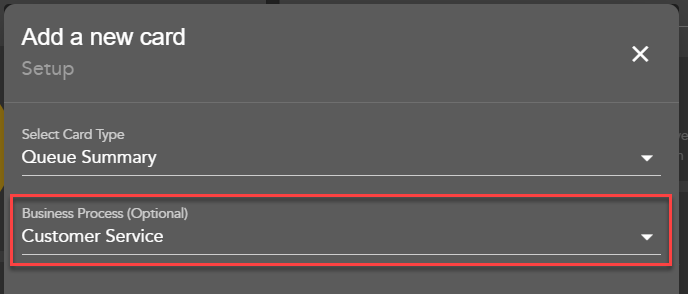
When selecting to add a Queue Summary or Queue Status card, you have the option to select which BP stats to show within the new card. . Select to add the card to your Dashboard view. Once created the Dashboard edit window will update to show your newly created card. The new card will show the selected Business Process if added on card creation.
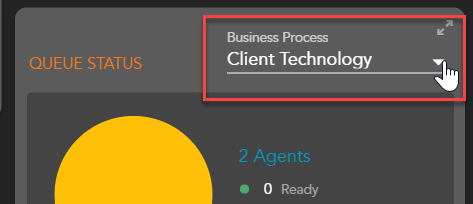
Note* - When a card is created to show a specific BP, you will be unable to adjust the BP chosen in the main Dashboard view. The Business Process drop down will be grayed out . If a new card is added with no BP selected on creation, the Business Process drop down will not be grayed out, allowing you to switch between which BP to show in the main Dashboard view.
Restore to Default
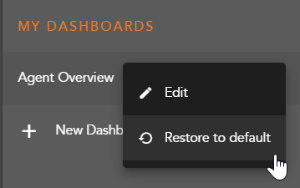
After making changes to the default Agent Overview Dashboard view, you can choose to restore the view to its original format. The original format would include its original title (Agent Overview) and just one Queue Status, Queue Summary and Key Performance Indicator (KPI) card. To restore to the default view, select menu options in the dashboard panel next to the dashboard and select Restore to Default The Restore to Default will only be available if you only have one dashboard created in the AIC Panel.
Adding a New Dashboard
Adding a New Dashboard
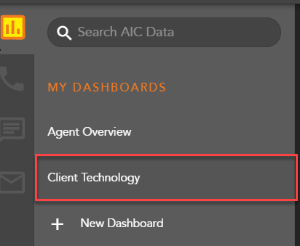
The AIC allows for agents to have multiple Dashboards. This provides agents the ability to customize different dashboard views and the cards within those views. Agents can have multiple dashboards and easily navigate between the views.
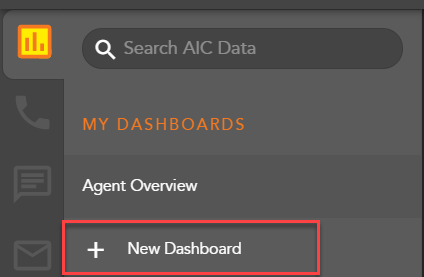
To add a new dashboard, select New Dashboard within the AIC Panel.
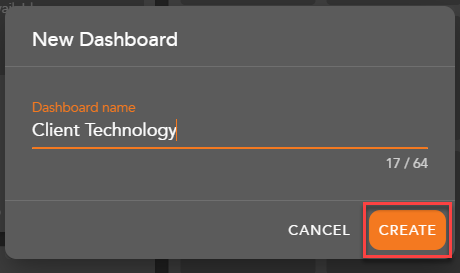
A New Dashboard window will open. Enter the name of the new Dashboard and select Create
Once created, the new Dashboard will appear in the AIC Panel. When you click on the dashboard, the dashboard view will be blank.
Click on either the menu options > edit or the Dashboard setup floating action button to begin adding new cards to the new Dashboard view. See Adding a New Card section to learn how to add new cards to your Dashboard view,
Deleting a Dashboard
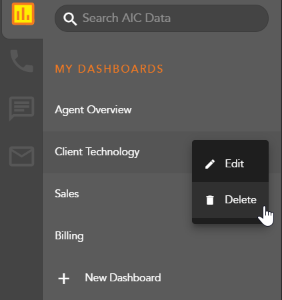
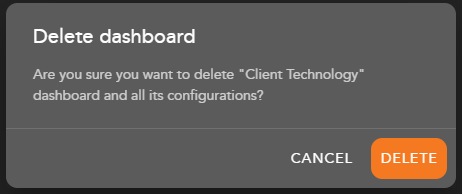
A Dashboard can be deleted if there are more than one Dashboard views in the AIC Panel. To delete a Dashboard view, select menu options > Delete A confirmation pop up will ask you to confirm you want to delete the dashboard. Select Cancel to cancel the deletion of the dashboard or Delete to confirm you wish to delete the dashboard.
